
 How to resolve AdBlock issue?
 A Look at How Email Opt-out Activity Changed in 2020-21

As we approach the halfway point of 2022, we’re now a bit over 2 years since Covid was declared a pandemic (March 11, 2020). At that point, it's safe to say that marketers had little to no idea how dramatically our businesses and marketing programs would be impacted. Now, with 2 years of hindsight, we can see how marketing was disrupted in the short-term and how some of those impacts are likely to have long-term ramifications for marketers in the years ahead.
Effectively every marketing channel was impacted, and email was certainly not left out. While many reports focus on positive email metrics covering email engagement or increasing email marketing budgets, it’s also instructive to look at negative marketing signals, such as opt-out requests, and how they were impacted over the past two years.
Every spring, OPTIZMO publishes its annual Email opt-out Infographic, based on data from the previous year. Not surprisingly, the last two years have delivered some interesting results, when compared to prior years, before the pandemic. At the same time, it’s intriguing to note that some metrics didn’t change as much as one might expect. Let’s dive into four metrics from the latest infographic (along with some data from the prior year’s release).
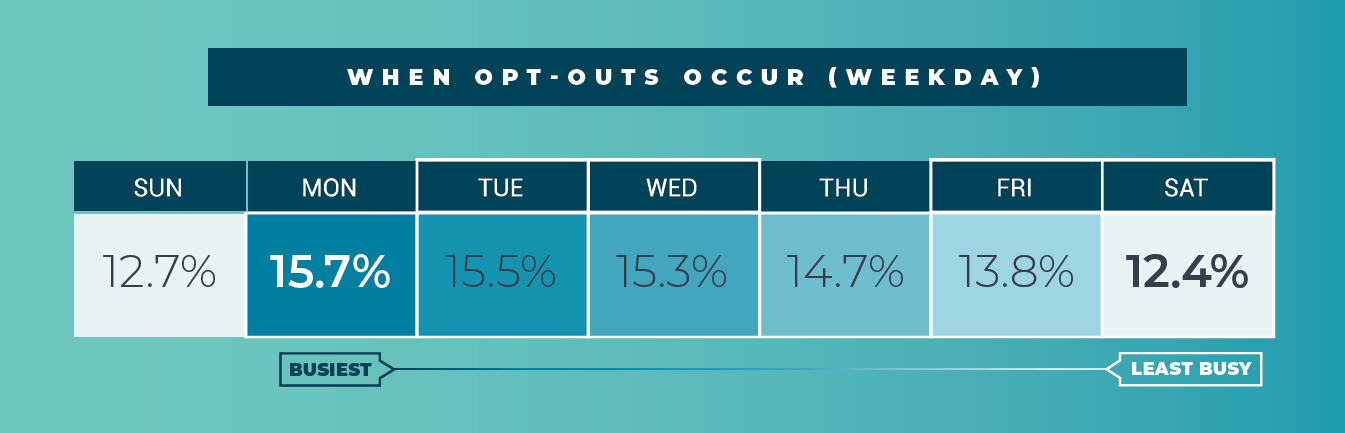
What Day is it Again?
As someone who has worked from home for many years, my day-to-day routine wasn’t impacted as more and more companies shifted to a remote work environment. However, as a veteran of the remote work world, I was already familiar with many of the disruptive changes it would bring for so many people who had never experienced working from home continuously for months or even years. One of the most common is having days blur together more than ever before. Losing track of what day of the week it is on any given day is a pretty common issue for people who work from home for a long period of time. Especially when people were spending their free time at home as well, there probably wasn’t a whole lot of difference between a Tuesday and a Saturday in many ways.
Traditionally, email opt-out activity peaks on Monday and then trends slowly downward each day through Saturday, with a slight uptick on Sunday. Would this change with everyone working from home? As it happens, people’s opt-out activity tended to follow the same pattern throughout 2020 and 2021. However, the numbers do show a slow flattening of the overall activity curve, where the variation from one day to the next lessened slightly. Does this show that on some level, people were impacted by having days blur together? We’ll probably have a better idea after this year when we analyze the 2022 numbers and see if the daily variation spreads out a bit again with many people heading back to the office.
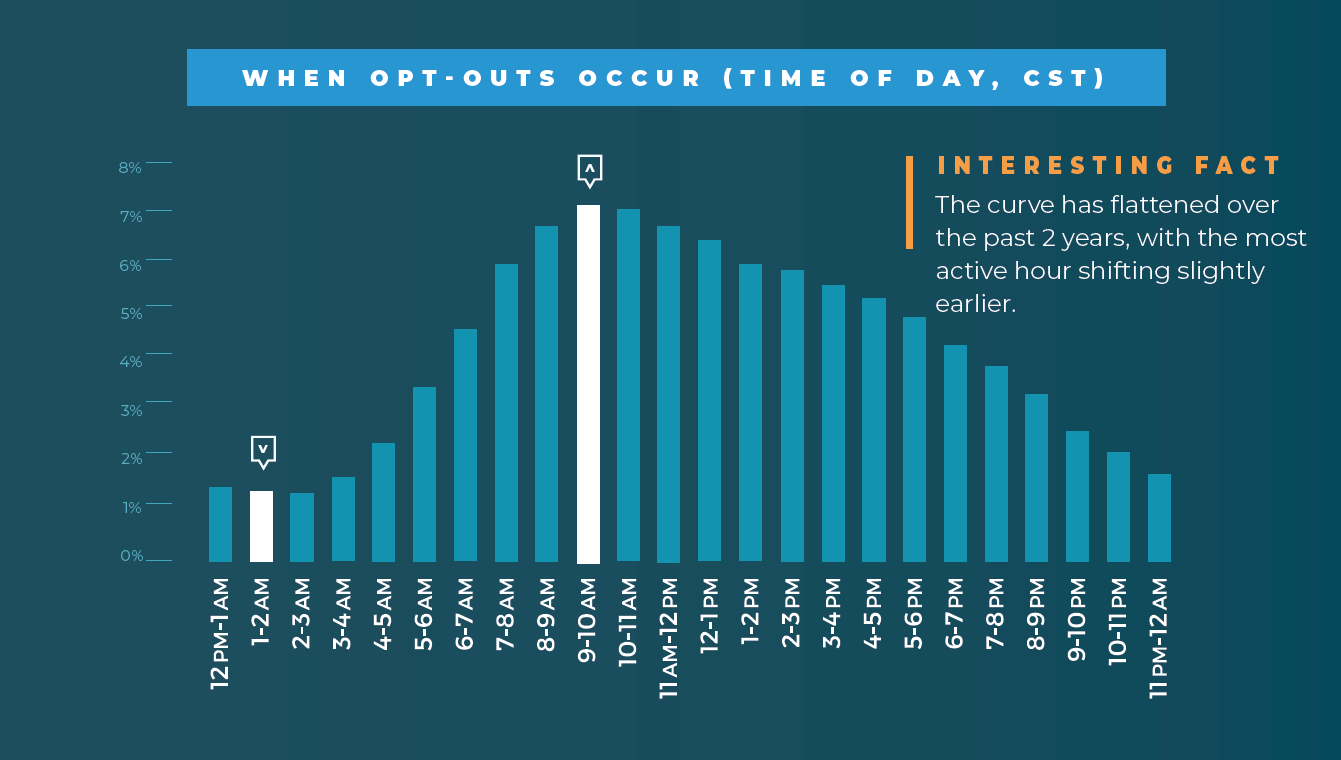
Hour of the Day
The impact of working from home was likely felt more keenly with the sudden removal of the daily commute to and from work. Up until 2019, the US workers had a one-way commute of about 28 minutes (on average). This means that a typical adult in the US spent about an hour a day simply traveling to and from work. For most people, this meant getting into their car and driving to and from the office. With the sudden shift to working from home, people were gaining back an hour of time during each day. It’s hard to overstate the impact of an extra hour of time in everyone’s daily calendar, in a culture where so many people feel like there simply aren’t enough hours in the day to get everything done.
So, we wondered if this extra hour of time would make an impact on email opt-out activity. Looking at a curve based on opt-out activity by the hour of the day, we did notice some shifts since 2019. While the overall pattern of opt-out activity at the lowest point just after midnight, and then ramping up as the workday gets started remained consistent, the busiest hour of the day shifted by one hour earlier in 2020 (10-11 am) and then another hour earlier in 2021 (9-10 am). This shift was accompanied by a slight smoothing of the downward trend in opt-out activity throughout the rest of the day, as the daytime hours all flattened somewhat. Will we see a reversal of this 2-hour shift in maximum opt-out activity in 2022?
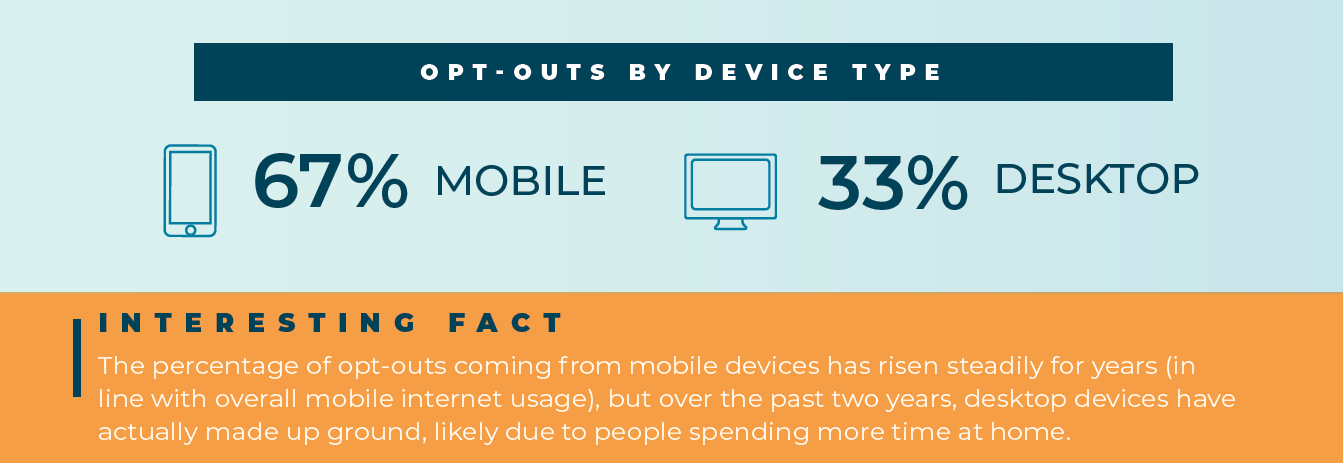
Mobile vs. Desktop
Since mobile devices with internet access gained popularity (largely starting in 2007 with the release of the first iPhone) the share of mobile internet usage has grown vs. traditional desktop interface usage. Around 2016, mobile devices became the predominant means of access to the internet for consumers. Effectively, the percentage of mobile internet usage has grown virtually every year going back well over a decade.
However, a major aspect of mobile’s appeal is that it is, well, mobile. So, what happens when people suddenly shift to spending nearly all their time at home? Would they still use their mobile devices out of habit, or would they shift more of their online activity to desktop devices?
In 2021 and then again in 2022, the percentage of email opt-outs that were generated on mobile devices dropped, when compared to prior years where we produced our annual infographics. In 2019, mobile accounted for 74% of email opt-out requests, but in 2021 that percentage dropped to 67% and it remained the same in 2021. More than in any other data we analyzed, the mobile vs. desktop percentage reflects the largest shift in email user activity, as people did indeed shift some of their internet activity over to desktop devices, as they spent more time at home.
This is another stat we’re intrigued to watch in 2022. Will we see more people return to using mobile devices to access their email inboxes and to opt-out of messaging they no longer wish to receive?
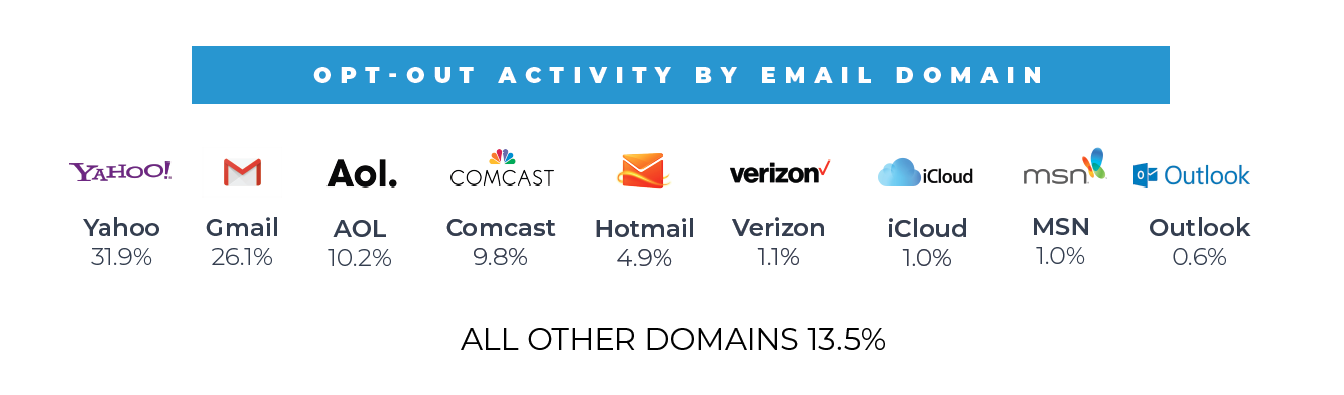
The Owners of the Inbox
When it comes to email domains and inbox providers, there are two clear owners of the marketplace, at least when it comes to opt-out activity. Since we began releasing these infographics in 2019, Yahoo! and Gmail have maintained a significant lead over other providers like AOL, Comcast, Hotmail, and a large number of smaller providers. Yahoo! has held the top spot consistently, but as of 2021, Gmail has made significant gains, largely by taking market share from the smaller providers. We actually processed email opt-outs from just under 1 million different email domains in 2021, with the vast majority producing fractions of a percent of overall opt-out activity.
After two years of unprecedented disruption in so many facets of personal and professional life, we are interested to see which behavior changes are likely to have lasting effects in 2022 and beyond. Will more companies adopt permanent remote work policies? It certainly seems likely. Will consumers return to shopping in brick-and-mortar stores in similar numbers as 2019 or will they continue using ecommerce options at a higher rate? Each of these shifts will continue to have a large impact on marketers in every channel, including email. One thing we can say with confidence is that email marketing remains arguably the most effective digital marketing channel for a large percentage of businesses in 2022 and if anything, the last two years have turned a spotlight on the channel and its resilience, even after over 40 years of consistent performance.
 Photo by Alain Pham on Unsplash
About the author
 Tom Wozniak is the head of Marketing and PR for OPTIZMO Technologies, delivering the industry’s most powerful platform for email compliance and suppression list management to clients throughout the U.S. and around the world.
Tom has over 20 years of experience in email, affiliate, and various other digital marketing channels. Prior to OPTIZMO, he was VP of Marketing at SpotX, headed up marketing at Media Breakaway, and held senior leadership roles with Trueffect and NextAction, among other companies. He regularly writes for several industry publications and speaks at various affiliate and email marketing industry events.