
 How to resolve AdBlock issue?
 Let's Get DEVICE-ive: Email Marketing Strategies for Android vs iPhone Users

Let’s begin with a thought experiment. Close your eyes for one second and imagine two people.
Person one is an Android user.
Person two is an iPhone user.
What do you see?
How are they the same?
How are they different?
What were they wearing? What cars do they drive? What other brands do they like? What pets do they have? Do they run? Do they play video games?
As marketers, it’s our job to generalize. We need to find patterns and preferences among like groups of people and use that knowledge to speak in their language.
The mobile device someone chooses says something about them, including how they like to be marketed to.
In this post, we’ll cover ways you can increase email marketing performance by catering to the different preferences of iPhone and Android users.
But first, some housekeeping.
The Battle for Mobile: iPhone and Android Market Penetration
Everyone has an Android phone, right? Or maybe you think the iPhone has 90%+ market penetration. Here are the numbers.
Android commands 70% of the global market share. If your audience is international, then you’d better understand this group. And while in the United States, iPhone is the market leader, the split is about 60% (iPhone) and 40% (Android).
The average retail price of an Android phone is under $300, whereas iPhone prices range from $429 to more than $1,000. As such, iPhone customers tend to fall into higher income brackets than Android customers.
Meanwhile both groups boast fierce device loyalty with 91% (Android) and 88% (iPhone) retention rates.
iPhone and Android users each represent hundreds of millions of users globally. And the mobile device they chose tells us quite a lot about how to market to them.
Let’s dive in.
This just in: Email is not dead 🙄 Frequency remains high across device types
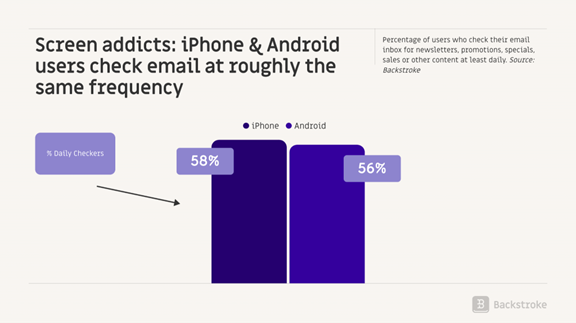
First things first. How frequently do mobile device users check their inbox for newsletters, promotions, specials, sales, or other content from brands?
It turns out close to 60% of users check their inbox for these emails at least daily, with Apple users slightly edging out Android users by just 2%.
While most of this analysis will focus on email, there's a lot of overlap with SMS. So I thought it was worth mentioning that Android users are noticeably more likely to check daily for promotional text messages from brands.
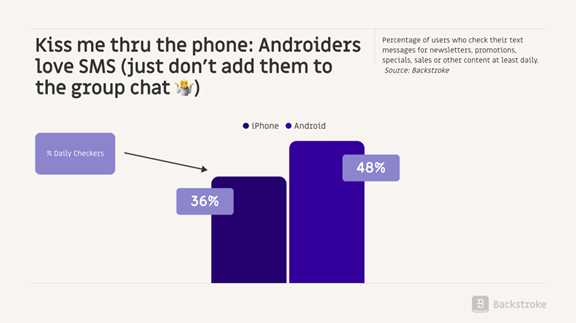
📱Dial it Up: This won’t surprise the OI regulars, but email checking frequency is high across both device types. That said, consider cranking up the SMS campaigns for customers on your Android lists.
Charge it! Key differences in discretionary spending categories
Where do iPhone and Android users spend their hard-earned money?
We looked at 11 of the top retail categories and pulled out any that had a spending index gap of five percentage points or more.
iPhone users outspend Android users on Apparel & Fashion and Health & Beauty. And no, we aren’t saying that iPhone users are more beautiful. We’re just saying that they try harder.
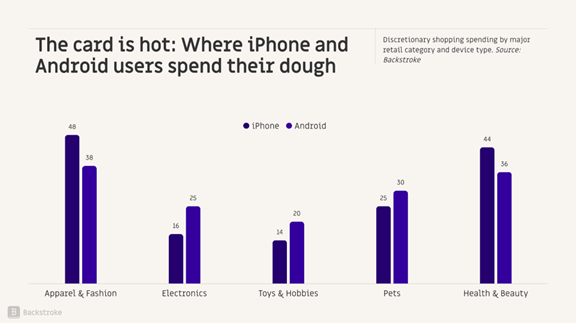
Meanwhile Android users spend more on Electronics, Toys & Hobbies, and Pets. So despite being gearheads and having a Dungeons and Dragons affinity, you can rest assured that little Spot is well taken care of 🐶.
📱Dial it Up: Brands should keep these spending tendencies in mind and consider matching relevant product promotions to device segments. Multi-category retailers should find this type of personalization particularly useful since their marketing teams likely push products across two or more of these categories.
How to write good: Letter case and length drives performance amongst device groups
When it comes to ramping up email marketing performance, seemingly small syntactic or grammatical changes go a long way.
These preferences can vary across demographic categories such as age, gender, income level, and geographic region.
And, well, you guessed it—they also vary by device type.
For example, Android users prefer title case 67% more than iPhone users. So You Might Try Writing Subject Lines and Headlines Like This for Android Users. But write them like this for iPhone users.
AND BOTH DEVICE GROUPS WILL RESPOND TO ALL CAPS SO DON’T BE AFRAID TO GET A LITTLE SCREAMY.
As for copy length, iPhone and Android users prefer brevity exactly equally. This is interesting in and of itself, as there were very few preferences in our analysis that were identical across both groups.
However, it gets more interesting when we overlay additional segments. For example, on a national scale, device users prefer brevity equally. But in major metros like San Francisco and New York, preference for brevity decreases dramatically amongst the Android population.
And in Boston, iPhone users prefer short, punchy email copy 2:1 compared to Android users! So keep it shaht, kid.
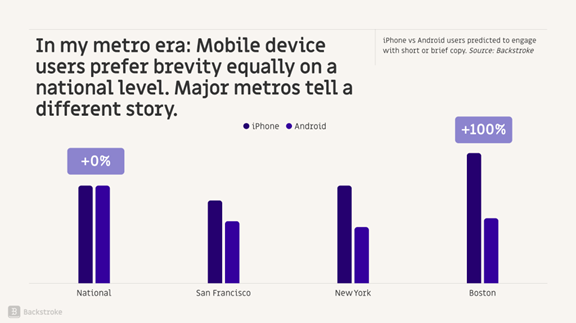
📱Dial it Up: When possible, use title case for Android users and sentence case for iPhone users. In major metros, favor brevity for iPhone users, but it’s OK to get a little more wordy for Androiders.
Emoji game strong: How and when brands should get extra expressive 😍😊🤟
Should you keep that emoji keyboard in its holster? Absolutely not. Both iPhone and Android people rank highly on the emoji index (in other words, emojis can work for both populations). That said, iPhone users outrank Android users 59 to 50, so when dealing with a heavy iPhone population, feel free to let the smiley faces rip.
In general, younger generations engage more with emojis, regardless of location, income, or other demographic criteria. With that said, we do see emoji engagement data change based on device type.
Gen Z iPhone users outpace Android on the engagement index by 45%. The gap tightens as users get older and eventually flips with Baby Boomers. So if you’re 65 or older, you’re actually more likely to engage with emojis if you’re an Android user!
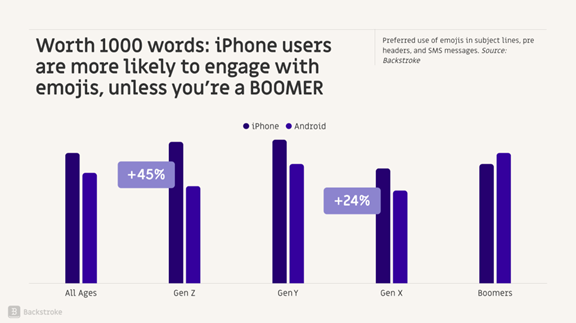
📱Dial it Up: Consider favoring emojis for iPhone users, especially in email segments that skew younger.
Show me where it hurts: The emotional impact of copy on messaging performance
Positive emotions like surprise, joy, and delight tend to perform the best in email subject lines, pre-headers, and headline copy. However, there is definitely a time and place to lean into negative emotions like sadness, anger, and disgust.
This is even more true when targeting Android users, who are more likely to engage with these strong, negative emotions.
Now, Android users—don’t get too upset (even though you might like that). This doesn’t imply anything about your personal emotional state. It only suggests you’re more likely to engage with strong negative emotions from brands when compared to your iPhone counterparts.
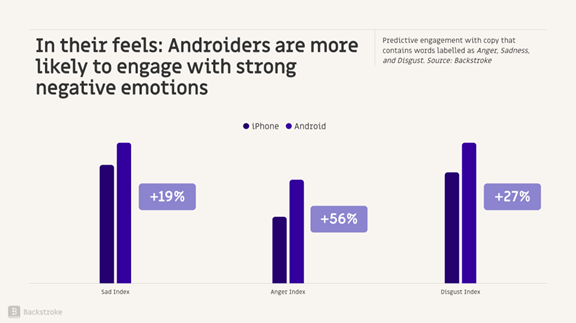
📱Dial it Up: Android users are more likely to engage with strong negative emotions. When needed, don’t be afraid to get in your feels when targeting Android-heavy segments.
Final thoughts
Understanding the distinct preferences and behaviors of Android and iPhone users is more than just a fun exercise—it’s a powerful strategy for boosting your email marketing performance.
By tailoring your approach to match the nuances of each device segment, you can create more personalized, impactful campaigns that resonate with your audience.
Whether it’s adjusting your copy style, incorporating emojis, or tapping into the right emotional triggers, the device your audience chooses can help your email marketing performance sing. So, the next time you hit send, remember: sometimes being a little DEVICE-ive can make all the difference.
 Photo by Rebecca Matthews on Unsplash
About the author

Egan Montgomery is a founder, researcher, and digital marketing expert with more than a decade of experience spanning both B2B and B2C marketing.
He is Co-founder and VP of Marketing at Backstroke, a generative content platform for email, SMS, and mobile push. Backstroke works primarily with eCommerce customers like Pearl iZUMi, Lyssé, Nathan Sports, and The Porch Swing Company to improve Revenue per Send by as much as 63% using AI-powered audience segmentation and generative content writing. Backstroke is funded by ExactTarget founders and run by former ExactTarget and Salesforce Marketing Cloud executives.
Egan is based in Indianapolis, IN. Outside of his work in email and tech, he loves hanging out with his family and our Golden Retriever, Pippa. Egan is an avid ultramarathon runner and a painfully average golfer. You can find him on LinkedIn where he posts almost daily.