
 How to resolve AdBlock issue?
 CRM vs. Email Marketing: How CRM techniques can help us think differently about email

In the B2C world what is the difference between CRM and email marketing? Nowadays the terms seem interchangeable. You only have to see many job ads that refer to CRM Manager who it seems sole responsibility is managing the email channel.
Yet I would say there is a significant difference in what a CRM Manager would do versus an email marketer. An email marketer is primarily focussed on data and actions directly related to email campaigns – open/click rates, deliverability and rendering, getting the campaigns out of the door and so on.
A CRM marketer would have a broader, more holistic remit that takes in email data, but would focus more on general customer data – who is ordering, what are they ordering, lifetime value and more – both subscribers and those who don’t get emails.
10 years ago I’d say I was definitely an email marketer first and foremost. I’d get referred to as ‘Email Sean’ by clients. But since then I’d definitely say I’m a CRM marketer first and foremost, and now I get referred to as ‘Data Sean!’
Thinking about this shift I realise how we’ve been able to take CRM techniques to improve the email marketing programmes we work on and get a fuller picture of what drives customer behaviour, and how factors external to email drive campaign response.
Here are 5 CRM reports I think would help those with a pure email focus think differently:
Customer Revenue Percentiles
Just looking in our ESP we tend to focus on what our overall list total is, and perhaps how many of these are engaged with email. There tends to be a correlation between this and where revenue is generated in your business - but who are the most important customers?
In this example we take all the customers who have ordered in the last 12 months and rank them by their spend in that time – by then looking at them in 10% groups, from the 10% most valuable to the least valuable 10% we can start to realise the importance of tiny amount of customers:
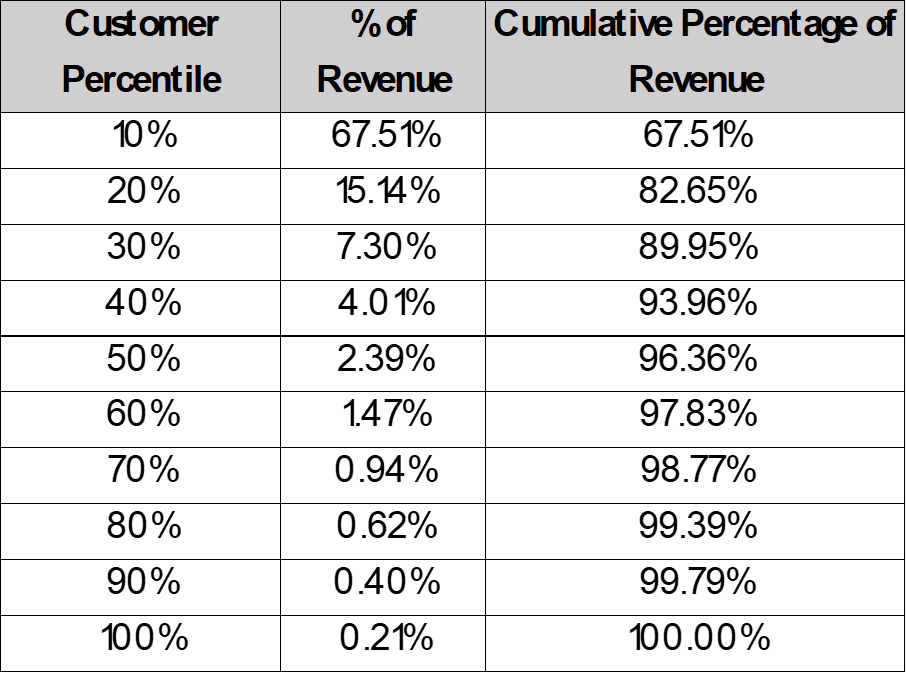
In this example just 10% of customers generate a 2/3 of the revenue in a year – and 80% of revenue from 20% of customers is typical. And if you know that you realise how important it is to stop these customers from churning – but also what an opportunity there is if you can increase their spend by 5% over the next year, and the impact this has on the bottom line.
It’s this type of report that can help an email marketer focus their time more efficiently.
RFM & Churn
In the email marketing world I see a lot of recipes for reactivating lapsed customers. ESPs create automated reactivation campaign triggers based upon time since last purchase. But these are almost always far too simplistic. By picking an arbitrary period like ‘365 days since last order’ don’t acknowledge the variations in lapsing behaviour across segments.
Here is a simple table that looks at how customers vary the maximum time between orders by the total number of times they have shopped in the past. We use both an average of the maximum time between orders and a median – the median doesn’t suffer from the odd customer going 5 years between orders skewing numbers:
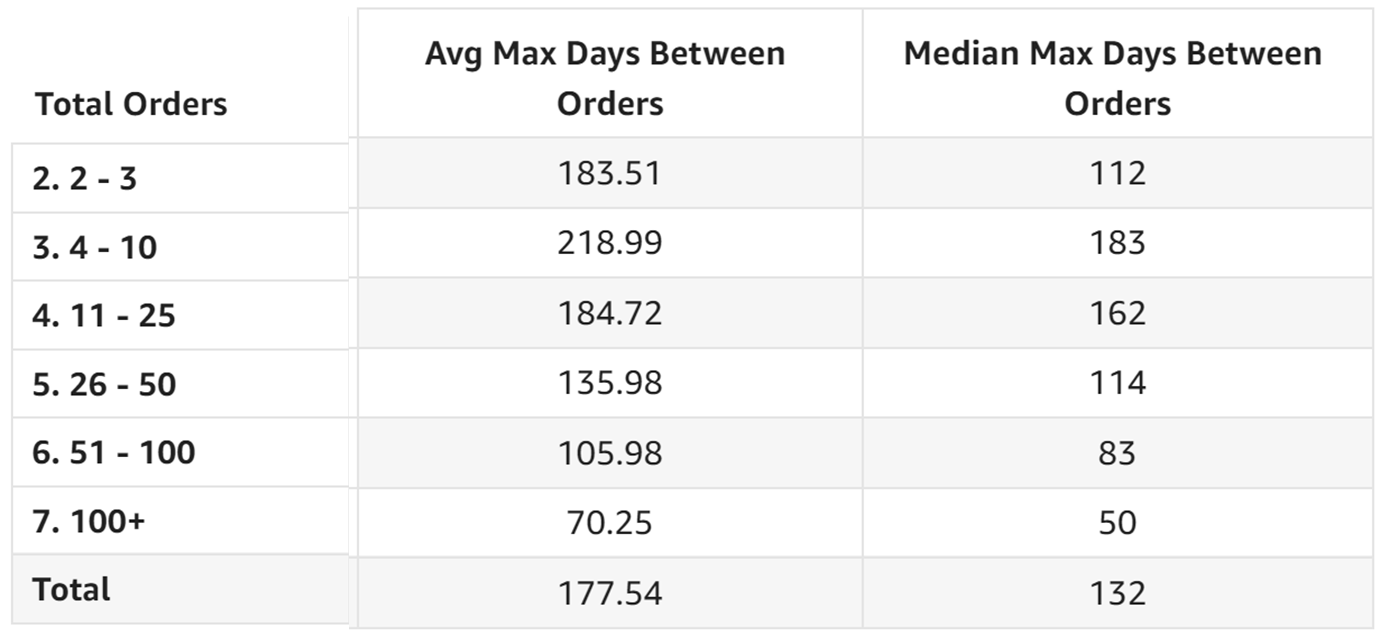
This shows that arbitrary numbers cause the problem of either waiting too long to try reactivating customers who will go completely dead, or going too soon and ‘reactivating’ customers who are in a normal lull in spending.
Taking it a stage further a RFM table (Recency since last purchase, Frequency of spend/number of orders & monetary value/total spend) to plot your existing customer base. Here we only look at time since last order and number of orders as usually number or orders and total spend are closely correlated anyway:
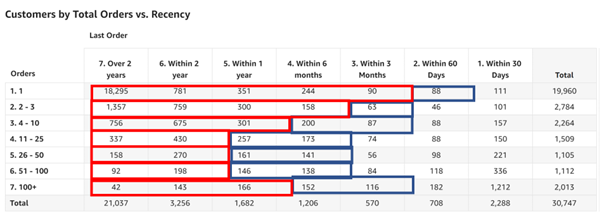
Overlaid on this in 2 colours are lapsing (blue) and lapsed (red) groups. Lapsing is where the data shows if they have gone this far since ordering they may come back of their own accord but unlikely. We probably don’t want to be too promotional to this audience as any discounts are likely to simply come from sales that would happen anyway. And our lapsed are where we have very strong confidence the customer has gone and we need to intervene – discounts, if applicable for the brand are worthwhile here.
It's useful to the email marketer as it gives much more refinement to their segmentation than the arbitrary numbers, but also highlights how just relying on a few triggers for reactivation isn’t going to dent the opportunity as most customers are past these arbitrary dates.
Cohorts
You could argue the biggest factor that impacts your email marketing programme performance is not how good your email creative is but simply the quality of subscribers in your list.
Not all subscribers are equal yet as email marketers we often get obsessed or targeted by list growth.
One way of evaluating the quality of subscribers being acquired is with cohort reporting. A cohort report puts customers into groups based upon when they first subscribed or placed their first order. Then we plot in the following periods – usually weekly or monthly periods how many of them shopped, or how much they spent.
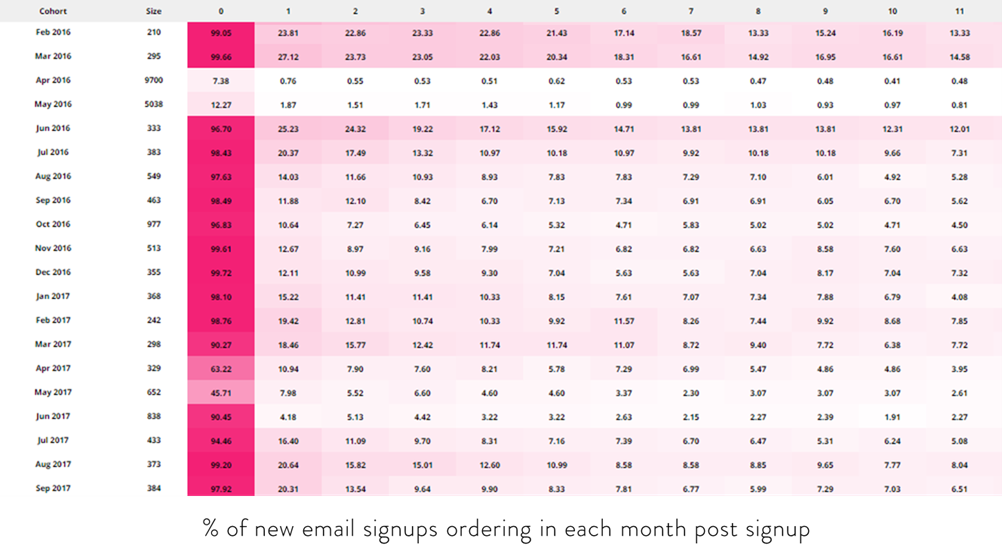
From this you can easily see with the lighter rows where changes in email acquisition activity has maybe delivered more subscribers, but not increased the quality as so few of them are shopping.
It will take time to notice the impact on overall revenue of these low value subscribers dragging your performance down as initially they will be a tiny percentage of your list. This way you can spot things early and win the argument to focus on quality over quantity.
Days to 2nd Purchase
Some sort of welcome, 2nd purchase or onboarding programme is nearly always something that an email marketer will spend significant amounts of time crafting.
I’ve lost count of the amount of times that these are designed without proper data points and end up being far too soft touch.
“They’ve just purchased, let’s not bother them for a few weeks.”
The idea to softly nurture a customer over a period of weeks, perhaps with one or two educational emails a week sounds good in theory – but is almost always not how customers behave in real life.
This report shows how quickly those customers who do get to 2nd purchase (Which typically for ecommerce brands is only 20-30% of customers) how quickly they do so, and what impact that has in lifetime value.
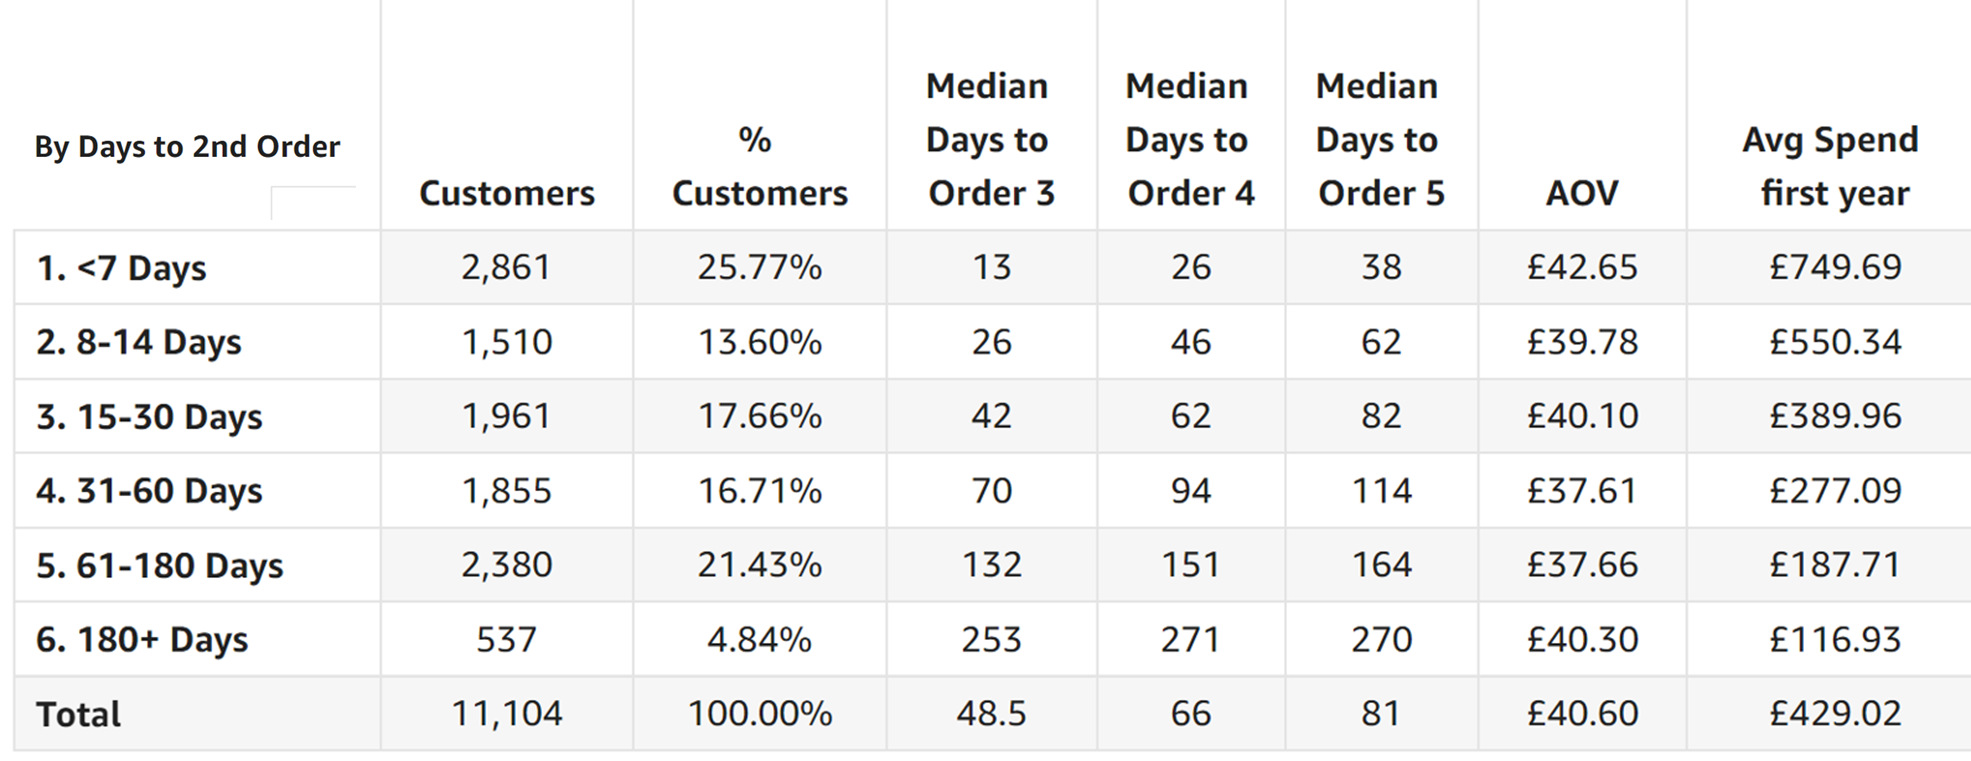
This normally makes people fall off their chairs when they see it – customers 2nd, 3rd and first few purchases happen far quicker than you’d expect – don’t be surprised if a high percentage of 2nd orders are placed before the first order arrives!
I’d say on average more than half of customers that do repeat, will do so within a month of their first order. Maybe within 2 months you are looking at that customer almost certainly not coming back again.
Again, this sort of CRM data gives email marketers a much clearer direction and insight when planning the crucial welcome programmes in content, promotions, frequency and timings.
One example that springs to mind. A softly, softly series of email sequential emails over a month was switched to 30 emails in 30 days driving next purchase rates up by over 15%.
What do they buy next?
You know personalisation outperforms generic email campaigns but how do you determine the nature of personalisation? And how do you ensure you even have the right data in your ESP to implement this?
Here is a simple view (although perhaps can be complicated to get to) that shows based upon a customers first purchase, what they buy in their 2nd:
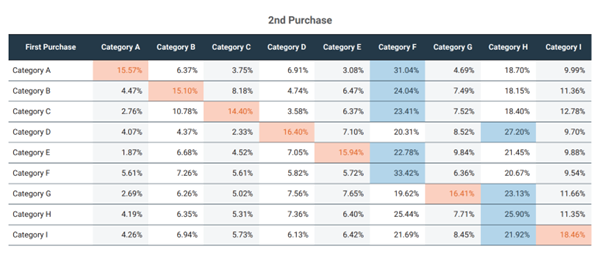
This uses product category but equally you could run this on other order attributes like price point, brand or promotion type.
Customers are almost always creates of habit – what they did last time allows you to predict what they will most likely do next, or at the very least what messaging might grab more attention. When you find a view that shows the strongest patterns between 1st and 2nd order, that almost creates your personalisation for you.
Of course, there are more sophisticated ways of doing this with affinity analysis and the like but this is a useful quick starting point.
So, does this mean I need a CDP?
I couldn’t finish without touching on this area. I’ve observed a few CDP’s over the last few years and in most of them you’d struggle to do a lot of the above anyway. Nearly all of this can be done with an Excel sheet of orders and a bit of knowledge of pivot tables and functions.
Most of all the most important thing is a shift in thinking to look beyond the bubble of the ESP and wider customer environment to not just your subscribers but all customers, and not just how a customer is engaging with email, but all customer touchpoints including orders, visits and more.
 Image courtesy of DALL-E -- "MIRROR IMAGE INK BLOT"
About the author
 Sean Duffy is founder of Segmentum, an eCRM strategy & implementation agency, and Reignite, a real-time email personalisation platform.
Sean has been in the email marketing industry since 2003, initially spending 10 years at a start-up ESP, helping establish them as one of the UK's leading email marketing platforms. Since then he has also worked client-side before creating Segmentum in 2015.