
 How to resolve AdBlock issue?
 How to Prevent or Reduce Website Traffic Declines in 2023: 8.8 Million Opportunities -- Google, SEO, and Email

As a marketer with a deep love and passion for email marketing I can’t ignore all the other marketing tactics and tools available to help our clients grow their business and reduce the risk of something very bad happening.
What could this very bad thing be? I’m happy you asked.
The recent Google updates in 2022 that caused many sites to see significant traffic/visitors decline.
No, this post is not a doom and gloom scare tactic.
It’s an opportunity to have a new discussion with our marketing teams, our clients, and fellow business owners.
I’m a marketer first and foremost, in most situations a problem solver.
This past year I’ve done a pretty deep dive into monetized content websites. I spoke on this topic at last year’s Email Innovation Summit in Las Vegas.
So, let me set the stage for today’s discussion by expanding on what my definition of a deep dive on this subject was for me.
Under NDA I reviewed and evaluated one-hundred-ninety-one content-based website focused on the US market. This includes reading the last two years of financial statements, and access to the sellers Google Analytics.
What I saw was shocking.
The actual traffic sources and attributed revenue (with several hidden gems).
The most glaring opportunity was the lack of any of these businesses building an email list to further communicate with their visitors to their websites.
In 2022 I bought eight of these content sites either for myself or a client investing approximately $1,560,00 USD. These site will collectively generate $500,000 USD in advertising revenue before we leverage the power of email marketing.
With my new found passion project of content websites have been invited to various forums and groups by the big three media aggregators AdThrive, MediaVine, and Ezoic.
While participating in these forums, I have seen a constant stream of discussion around Google update, the effect on traffic, declining revenue, and general SEO.
As marketers, we can’t anticipate when Google will update their proprietary algorithm, or the effect on our businesses.
However, based on history, we can expect them.
My ah ha moment.

Google Update Recovery Plan.
Plan for future Google updates. Plan for these updates to potentially affect your website rankings, therefore your traffic.
Focus more resources on building your email list. Or in the case of the eight sites I’ve bought, start an email list.
Place a retargeting pixel on your website with an adnetwork. You don't have to run ads, but start collecting the first party visitor data. Then if needed, you could turn on ads to previous website visitors within 24 hours.
When that next Google update is rolled out, you’re now prepared to take control of communicating with your website visitors and potential customers.
In the case of the business we’ve purchased, that’s eight million eight hundred thousand opportunities (the number of page view per year) to sign them up and run retargeting ads.
Many of us know that email marketing can stand on its own as a very profitable marketing tactic … well duh!
However, this may just be a new discussion to have for those who have not yet drunk the Kool-Aid.
“Risk mitigation for drastic declines in web traffic due to a Google update or a social media account being banned”.
For me, it’s also a new revenue source because the sites I targeted and bought do not have an email list yet.
So, this may not be sexy, cool, or anything new for you, however, it may be a new way to start the conversation about email marketing for your company or clients. Additional data to keep or increase your email marketing team and budget.
For those of you wanting a little more data, below are two data sets.

- Google Updates in 2022
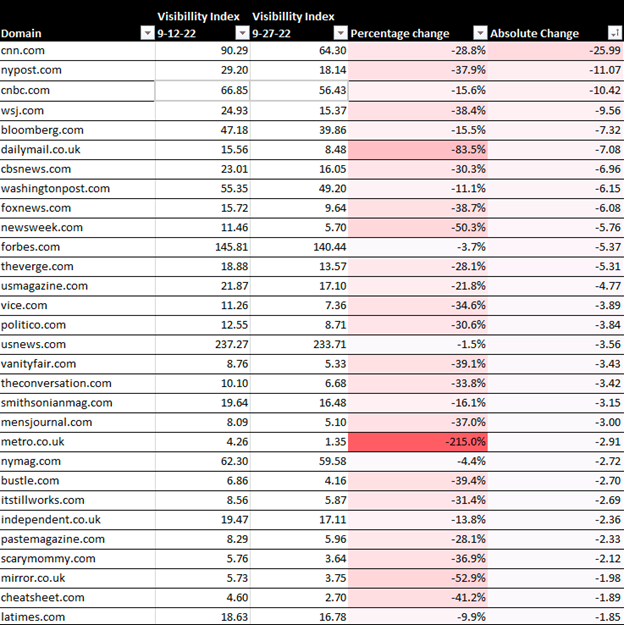
- Absolute Winners and Absolute Losers - Selected Sites Affected by Google Updates. Selected sites affected by the updates.
September 2022 Product Reviews Update — September 20, 2022
Confirmed
Google released their fifth Product Reviews Update, lasting until September 26th. This update completely overlapped the September Core Update. Ranking flux across both updates peaked at 94.7° on September 21st, wrapping up a tumultuous month.
September 2022 Core Update — September 12, 2022
Confirmed
The second Core Update of 2022 rolled out on the heels of the Helpful Content Update, complicating any attempts at analysis. The update officially lasted until September 26th, but ranking flux spiked early, with MozCast measuring 94.0° on September 12th.
Helpful Content Update — August 25, 2022
Confirmed
The Helpful Content Update aimed to reward "people-first" content and devalue content written primarily for SEO. It officially rolled out over two weeks (wrapping up on September 9th), with an unusual pre-announcement just one week in advance. There were no clear signs of broad impact.
Data Center Outage — August 9, 2022
Confirmed
An accident at a Google data center in Council Bluffs, Iowa may have resulted in massive ranking fluctuations, with MozCast hitting a historical high of 123.6°F. In some cases, searchers could not access results at all. Search results appeared to normalize the next day.
July 2022 Product Reviews Update — July 27, 2022
Confirmed
Google's fourth Product Reviews Update (PRU) rolled out over the course of a week, wrapping up on August 2nd. Ranking flux on MozCast peaked at 98.8° on the last day of the update. There were no details from Google on how this update differed from the previous three PRUs.
Unnamed Update — July 8, 2022
Unconfirmed
MozCast measured high volatility on both July 8th (103.9°) and July 6th (101.9°). While some SEOs and rank tracking tools observed major changes during this time period, Google did not confirm an update, and no clear details emerged.
Unnamed Update — June 27, 2022
Unconfirmed
MozCast spiked at 109.0° on June 27th, measuring unusually high ranking flux even for a historically high-activity summer. Google provided no details nor confirmation, and the nature of the update remains unclear.
May 2022 Core Update — May 25, 2022
Confirmed
On May 25th, Google announced the rollout of a core update. The rollout lasted roughly 2 weeks and was completed on June 9th. MozCast recorded peak ranking flux at 103.0°F on May 25th, the first day of the rollout. As with most Core Updates, Google did not provide specifics.
March 2022 Product Reviews Update — March 23, 2022
Confirmed
Google confirmed a significant product reviews update and changed the naming convention to match the Core Updates. The update officially took 19 days to roll out, starting on March 23rd, and built on previous product review updates to identify high quality product reviews.
Unnamed Update — March 18, 2022
Unconfirmed
Multiple SERP trackers picked up high flux around March 18-19, with MozCast peaking at 101.1°F on March 18th. No update was officially confirmed, and Danny Sullivan of Google tweeted that "I did check, no one knows of any broad, major update."
Page Experience Update (Desktop) — February 22, 2022
Confirmed
Google announced that the Page Experience Update previously released on mobile SERPs would be rolled out to desktop. This rollout officially occurred from February 22nd to March 3rd. MozCast peaked at 99.4°F on March 3rd and 98.8°F on February 23rd.
Unnamed Update — February 5, 2022
Unconfirmed
MozCast measured historically high-ranking flux of 105.4°F on February 5th, with a possible aftershock of 102.5°F on February 7th. Some other flux trackers picked up similar spikes, but no update was officially confirmed.
Unnamed Update — January 10, 2022
Unconfirmed
During a period of relatively high volatility, MozCast recorded a temperature spike of 102.1°F on January 10th. No Google update was confirmed, but industry chatter picked up ranking changes on January 11th.
SOURCE: moz.com/google-algorithm-change
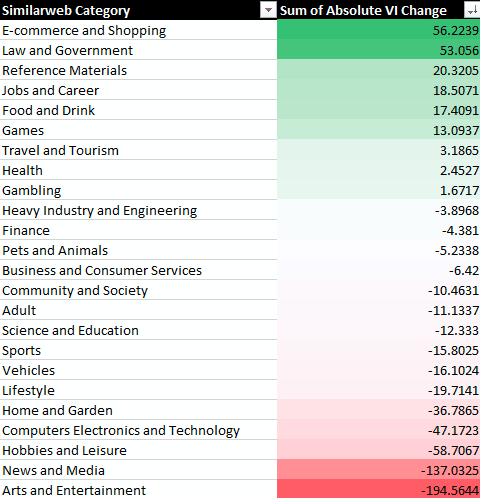
Analysis of the 2022 September Core Update & Product Review Update & Impacts Across Categories
By comparing Similarweb categories with total Sistrix visibility index changes, we can see the impact that this update had across categories. The “absolute VI change” scores shown here are a net figure that represents how much organic market share was gained or lost in each category as a result of these updates.
|
Domain |
9-12-22 VI |
9-27-22 VI |
Percentage Change |
Absolute Change |
|
Absolute winners in terms of greatest Visibility Index score increases, which represents the total overall market share gained on Google: |
||||
|
wikipedia.org |
5930.75 |
6204.31 |
5% |
273.56 |
|
amazon.com |
2988.54 |
3226.23 |
8% |
237.69 |
|
wiktionary.org |
543.91 |
673.62 |
24% |
129.71 |
|
facebook.com |
1003.52 |
1070.32 |
7% |
66.80 |
|
cdc.gov |
158.68 |
202.09 |
27% |
43.41 |
|
microsoft.com |
431.66 |
473.67 |
10% |
42.01 |
|
spotify.com |
226.71 |
266.07 |
17% |
39.36 |
|
cambridge.org |
492.70 |
529.45 |
7% |
36.75 |
|
instagram.com |
650.22 |
684.20 |
5% |
33.98 |
|
tiktok.com |
49.60 |
78.26 |
58% |
28.67 |
|
azlyrics.com |
90.31 |
114.50 |
27% |
24.19 |
|
google.com |
636.80 |
660.96 |
4% |
24.16 |
|
mayoclinic.org |
271.31 |
289.46 |
7% |
18.16 |
|
nytimes.com |
234.32 |
251.53 |
7% |
17.22 |
|
imdb.com |
958.47 |
974.15 |
2% |
15.67 |
|
last.fm |
30.29 |
45.11 |
49% |
14.82 |
|
collinsdictionary.com |
289.23 |
303.10 |
5% |
13.88 |
|
bls.gov |
35.23 |
48.68 |
38% |
13.45 |
|
wikivoyage.org |
34.29 |
46.52 |
36% |
12.23 |
|
irs.gov |
79.20 |
89.82 |
13% |
10.62 |
|
indeed.com |
201.78 |
211.95 |
5% |
10.17 |
|
realtor.com |
151.21 |
161.19 |
7% |
9.98 |
|
expedia.com |
189.23 |
198.96 |
5% |
9.73 |
|
nih.gov |
242.67 |
252.33 |
4% |
9.67 |
|
nerdwallet.com |
83.96 |
93.08 |
11% |
9.11 |
|
twitter.com |
269.40 |
277.68 |
3% |
8.29 |
|
bandcamp.com |
26.19 |
34.37 |
31% |
8.19 |
|
pcmag.com |
119.09 |
127.15 |
7% |
8.06 |
|
adobe.com |
102.92 |
110.92 |
8% |
7.99 |
|
nintendo.com |
33.36 |
41.33 |
24% |
7.97 |
|
yelp.com |
135.85 |
143.75 |
6% |
7.90 |
|
canon.com |
39.92 |
47.64 |
19% |
7.71 |
|
urbandictionary.com |
139.51 |
147.04 |
5% |
7.53 |
|
github.com |
57.95 |
65.37 |
13% |
7.42 |
|
tripadvisor.com |
478.17 |
485.55 |
2% |
7.38 |
|
mapquest.com |
88.27 |
95.55 |
8% |
7.27 |
|
bankofamerica.com |
32.82 |
39.90 |
22% |
7.08 |
|
softonic.com |
41.39 |
48.45 |
17% |
7.06 |
|
rateyourmusic.com |
17.84 |
24.79 |
39% |
6.95 |
|
ldoceonline.com |
39.55 |
46.49 |
18% |
6.94 |
|
vocabulary.com |
202.08 |
208.88 |
3% |
6.80 |
|
kidshealth.org |
35.55 |
42.29 |
19% |
6.74 |
|
travelandleisure.com |
33.66 |
40.23 |
20% |
6.56 |
|
justice.gov |
15.13 |
21.67 |
43% |
6.54 |
|
allrecipes.com |
52.67 |
59.17 |
12% |
6.49 |
|
lyrics.com |
51.12 |
57.21 |
12% |
6.10 |
|
ed.gov |
33.22 |
39.21 |
18% |
6.00 |
|
uscourts.gov |
14.78 |
20.67 |
40% |
5.89 |
|
goodrx.com |
11.36 |
17.07 |
50% |
5.71 |
|
house.gov |
20.14 |
25.79 |
28% |
5.64 |
Absolute losers in terms of greatest Visibility Index score decreases, which represents the total overall market share lost on Google:
|
Domain |
9-12-22 VI |
9-27-2022 VI |
Percentage Change |
Absolute Change |
|
|
||||
|
youtube.com |
2519.62 |
2397.10 |
-5% |
-122.52 |
|
yourdictionary.com |
155.72 |
44.59 |
-71% |
-111.14 |
|
merriam-webster.com |
1240.56 |
1130.69 |
-9% |
-109.87 |
|
linkedin.com |
307.06 |
230.66 |
-25% |
-76.40 |
|
fandom.com |
514.43 |
444.13 |
-14% |
-70.30 |
|
target.com |
517.09 |
452.37 |
-13% |
-64.73 |
|
britannica.com |
674.16 |
620.67 |
-8% |
-53.49 |
|
thefreedictionary.com |
228.60 |
178.95 |
-22% |
-49.65 |
|
ebay.com |
744.46 |
709.23 |
-5% |
-35.23 |
|
investopedia.com |
236.61 |
201.81 |
-15% |
-34.80 |
|
genius.com |
237.85 |
203.34 |
-15% |
-34.51 |
|
tvtropes.org |
47.61 |
15.09 |
-68% |
-32.52 |
|
webmd.com |
283.49 |
251.01 |
-11% |
-32.48 |
|
ca.gov |
156.32 |
126.02 |
-19% |
-30.30 |
|
walmart.com |
790.75 |
763.61 |
-3% |
-27.14 |
|
pinterest.com |
481.96 |
455.42 |
-6% |
-26.54 |
|
cnn.com |
90.29 |
64.30 |
-29% |
-25.99 |
|
techradar.com |
75.49 |
49.58 |
-34% |
-25.92 |
|
healthline.com |
230.98 |
207.65 |
-10% |
-23.33 |
|
apple.com |
242.01 |
220.47 |
-9% |
-21.54 |
|
lifewire.com |
97.29 |
77.49 |
-20% |
-19.80 |
|
cornell.edu |
99.50 |
81.25 |
-18% |
-18.25 |
|
definitions.net |
42.37 |
24.92 |
-41% |
-17.45 |
|
crunchbase.com |
64.70 |
47.70 |
-26% |
-17.00 |
|
bestplaces.net |
39.76 |
23.53 |
-41% |
-16.23 |
|
spanishdict.com |
34.61 |
19.80 |
-43% |
-14.81 |
|
discogs.com |
77.55 |
62.81 |
-19% |
-14.73 |
|
unsplash.com |
103.66 |
89.49 |
-14% |
-14.17 |
|
bedbathandbeyond.com |
95.04 |
81.88 |
-14% |
-13.16 |
|
clevelandclinic.org |
149.74 |
136.64 |
-9% |
-13.11 |
|
businessnewsdaily.com |
34.93 |
21.86 |
-37% |
-13.07 |
|
tomsguide.com |
39.17 |
27.09 |
-31% |
-12.08 |
|
techtarget.com |
96.56 |
84.55 |
-12% |
-12.00 |
|
gamesradar.com |
31.59 |
19.96 |
-37% |
-11.63 |
|
kohls.com |
77.63 |
66.45 |
-14% |
-11.18 |
|
pbs.org |
38.48 |
27.38 |
-29% |
-11.09 |
|
nypost.com |
29.20 |
18.14 |
-38% |
-11.07 |
|
medicalnewstoday.com |
106.76 |
95.82 |
-10% |
-10.94 |
|
lovetoknow.com |
21.89 |
11.47 |
-48% |
-10.42 |
|
cnbc.com |
66.85 |
56.43 |
-16% |
-10.42 |
|
alamy.com |
27.20 |
16.98 |
-38% |
-10.22 |
|
kayak.com |
153.71 |
143.50 |
-7% |
-10.21 |
|
tenor.com |
15.80 |
5.91 |
-63% |
-9.90 |
|
zillow.com |
169.16 |
159.46 |
-6% |
-9.71 |
|
nolo.com |
21.52 |
11.81 |
-45% |
-9.71 |
|
wsj.com |
24.93 |
15.37 |
-38% |
-9.56 |
|
foursquare.com |
19.16 |
9.83 |
-49% |
-9.33 |
|
lowes.com |
186.83 |
177.84 |
-5% |
-9.00 |
|
encyclopedia.com |
17.64 |
9.00 |
-49% |
-8.64 |
|
dreamstime.com |
28.37 |
20.11 |
-29% |
-8.26 |
SOURCE:
www.amsivedigital.com/insights/seo/winners-losers-of-the-september-2022-core-update-product-reviews-update/
See y’all in the inbox.
Doug :)
Additional Resources: - Doug’s recent articles
About the author

Doug is an Author, Investor, Speaker, Podcaster, Fractional CMO, ERP Consultant, and Media Buyer - specializing in Sponsored Email. a CrossFit & Olympic Weightliufting athlete, husband, dad, and granddad.
His first book “THREE BIG LIES – The Real Truth About Renting Email Lists to Generate Targeted Leads and Sales” became an International Best Seller.