
 How to resolve AdBlock issue?
 How Changing Our Email Newsletter Frequency Boosted Engagement by 500% [Case Study]

If you’re a regular reader of the Only Influencers (OI) newsletter, you may have noticed a shift in 2024.
We took the OI newsletter from once a week to twice-a-week — moving from Wednesday drops to Tuesday and Thursday sends.
Why?
Because our content had outgrown its container.
Here’s what we had been including in every issue:
- One or two posts from the Only Influencers blog
- Articles and insights from OI members
- Content from companies our members work for
- Industry highlights and trends worth your attention
- Two house ads promoting OI events or initiatives
With that much goodness, our weekly issues regularly ran 12 or 13 items deep – here’s an example. Long. And while the top items got clicks, those lower down? Not so much. Barely a nibble.
So we tried something different: splitting that content across two issues, sent twice a week. This got our item count down to 6 or 8 per issue. And it gave us 2 more house ad spaces to promote OI events and initiatives (Here’s one of those to view).
Yes, it was a little more work — but only a little, especially when batching and scheduling ahead.
Our goal?
Boost engagement — specifically, traffic to the sites featured in the newsletter (a.k.a. total clicks).
Did it work?
I pulled a side-by-side comparison of Q4 2023 (weekly sends) and Q4 2024 (twice-weekly sends). Here's what I found:
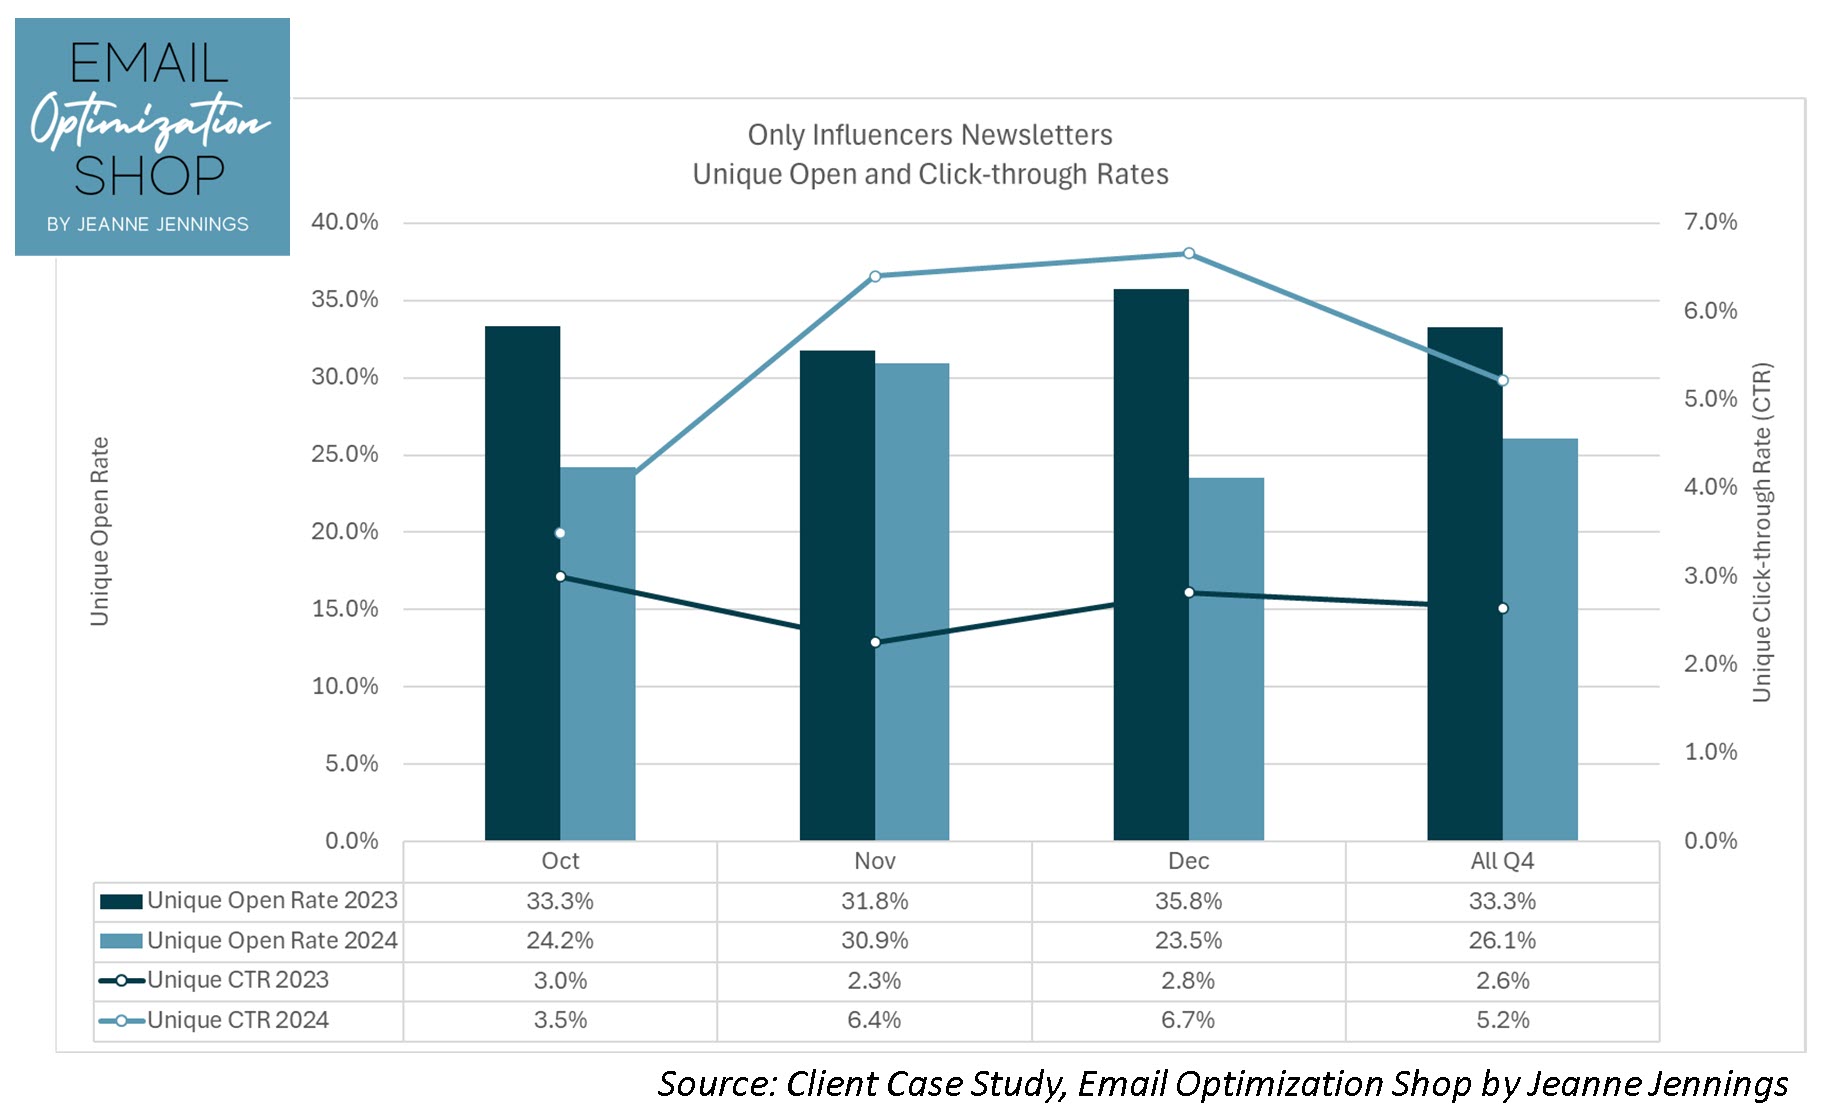
Our unique open rates dipped a bit — but our unique click-through rates? They climbed. Dramatically.
Here’s a variance report:
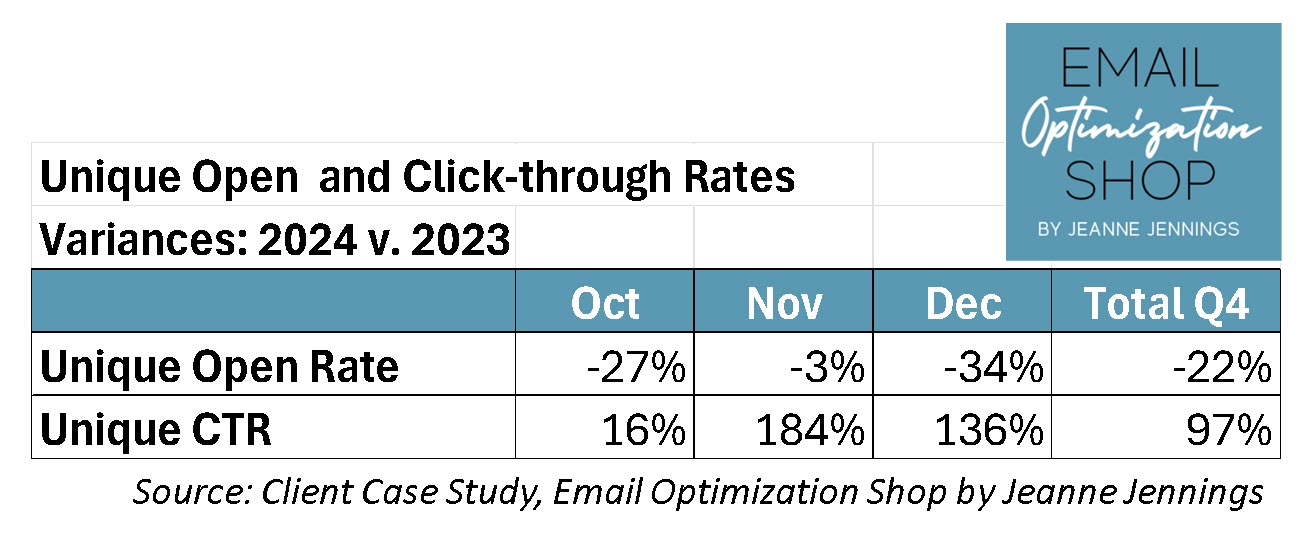
By breaking our content into two issues, we gave each piece more breathing room. And it paid off — engagement (measured by clicks) shot up.
But here’s the real question:
Did we actually send more traffic to the sites we featured?
Take a look at the total clicks we sent from the newsletter to external websites — charted month by month.
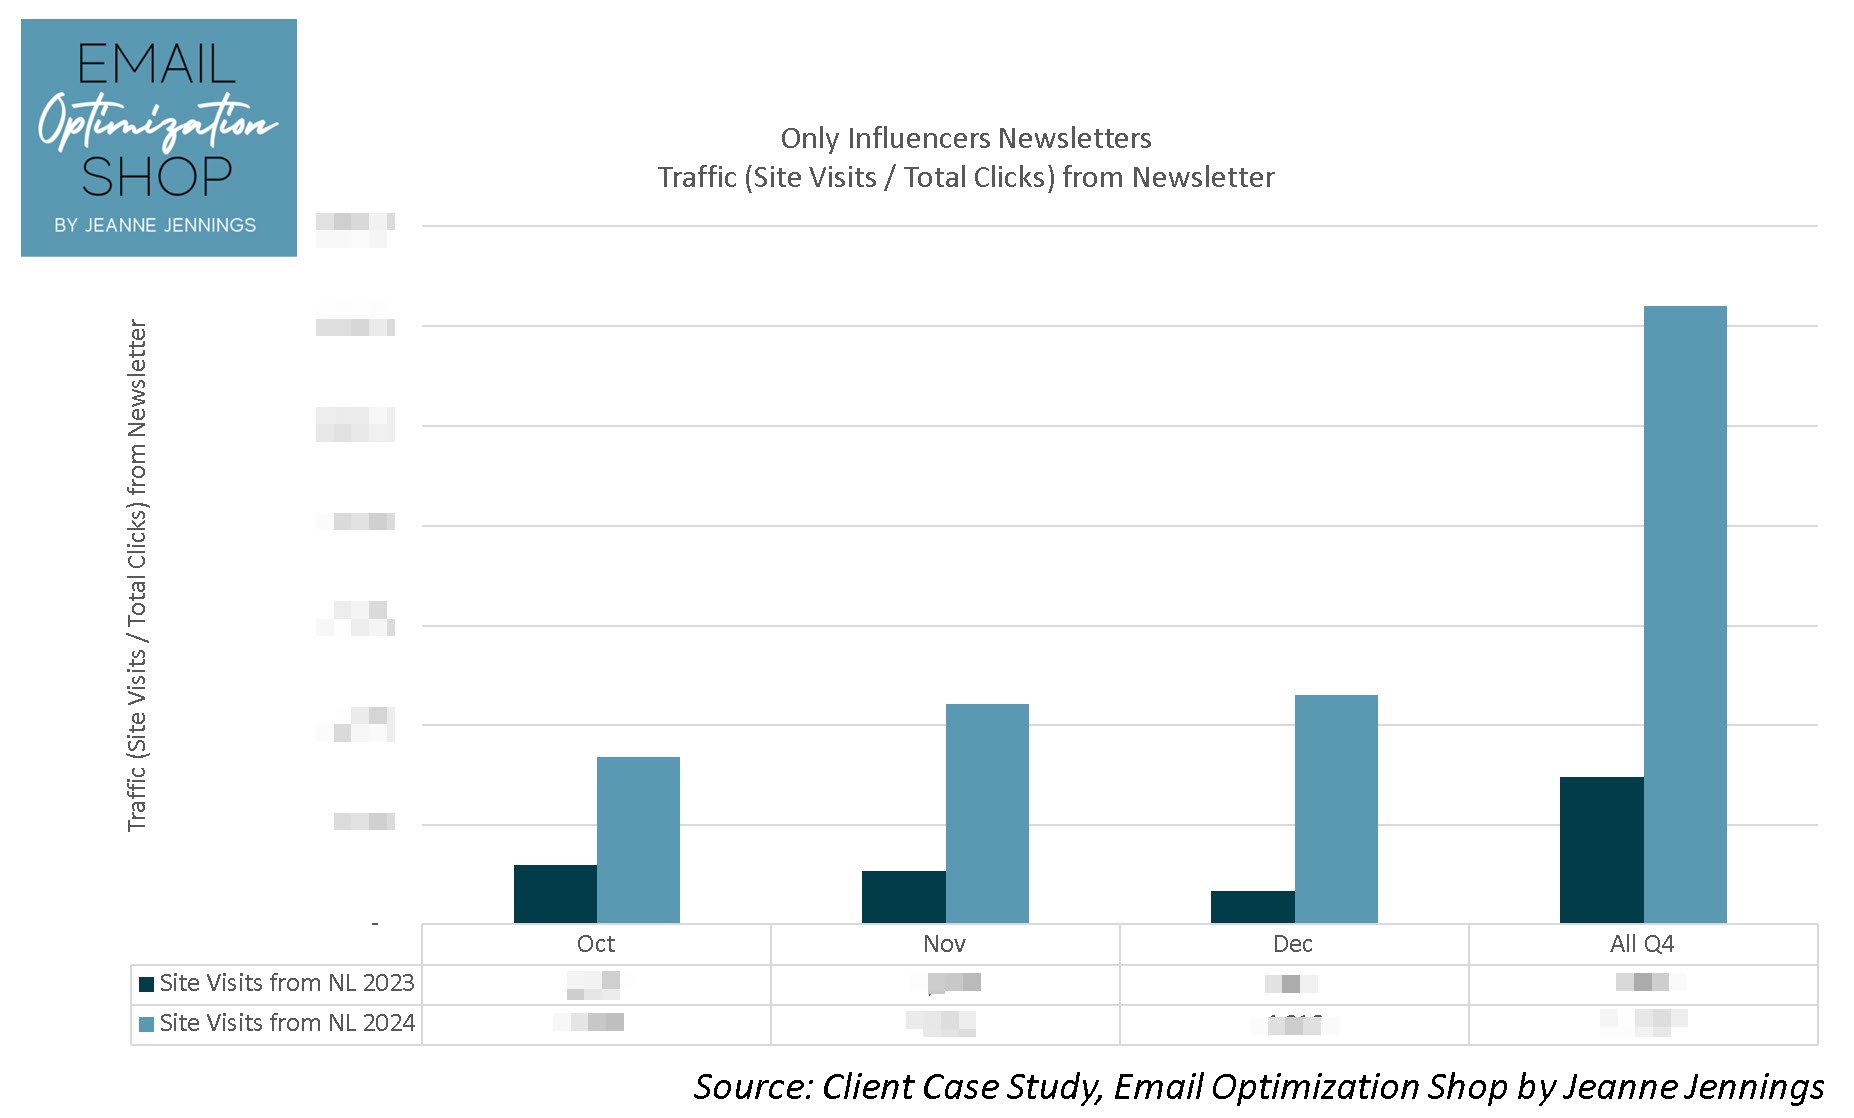
Spoiler alert: We did. The data speaks loud and clear (although I had to blur out the exact numbers for client privacy).
Here’s the variance report (with nothing redacted):
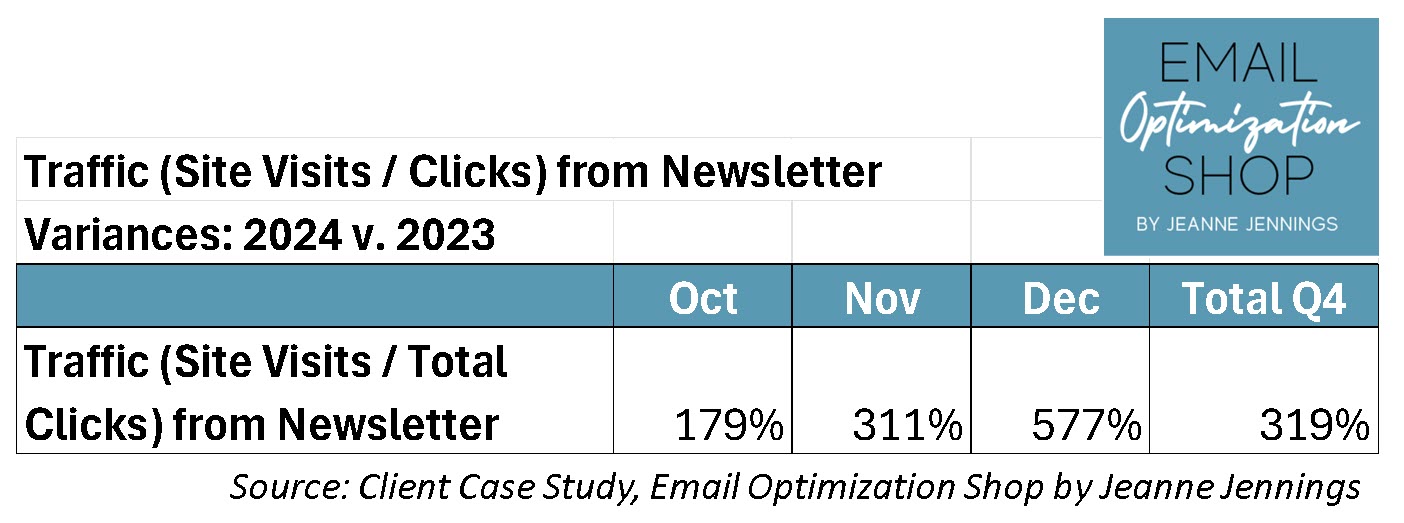
Depending on the month, total clicks increased anywhere from 179% to 577%.
Yes, you read that right.
But then I wondered...
Are we getting more clicks from the same core group of subscribers?
Or are we expanding reach — engaging more of our list?
That’s where reach rate comes in. I’ve written about this metric before (see the “View from the Roof” section in this post), but here’s the quick version: Reach rate = % of subscribers who click at least once during the measured period.
Rather than traditional area charts (which make month-to-month comparison tough), I visualized the monthly reach rates in a bar chart. Much easier to scan and spot trends.
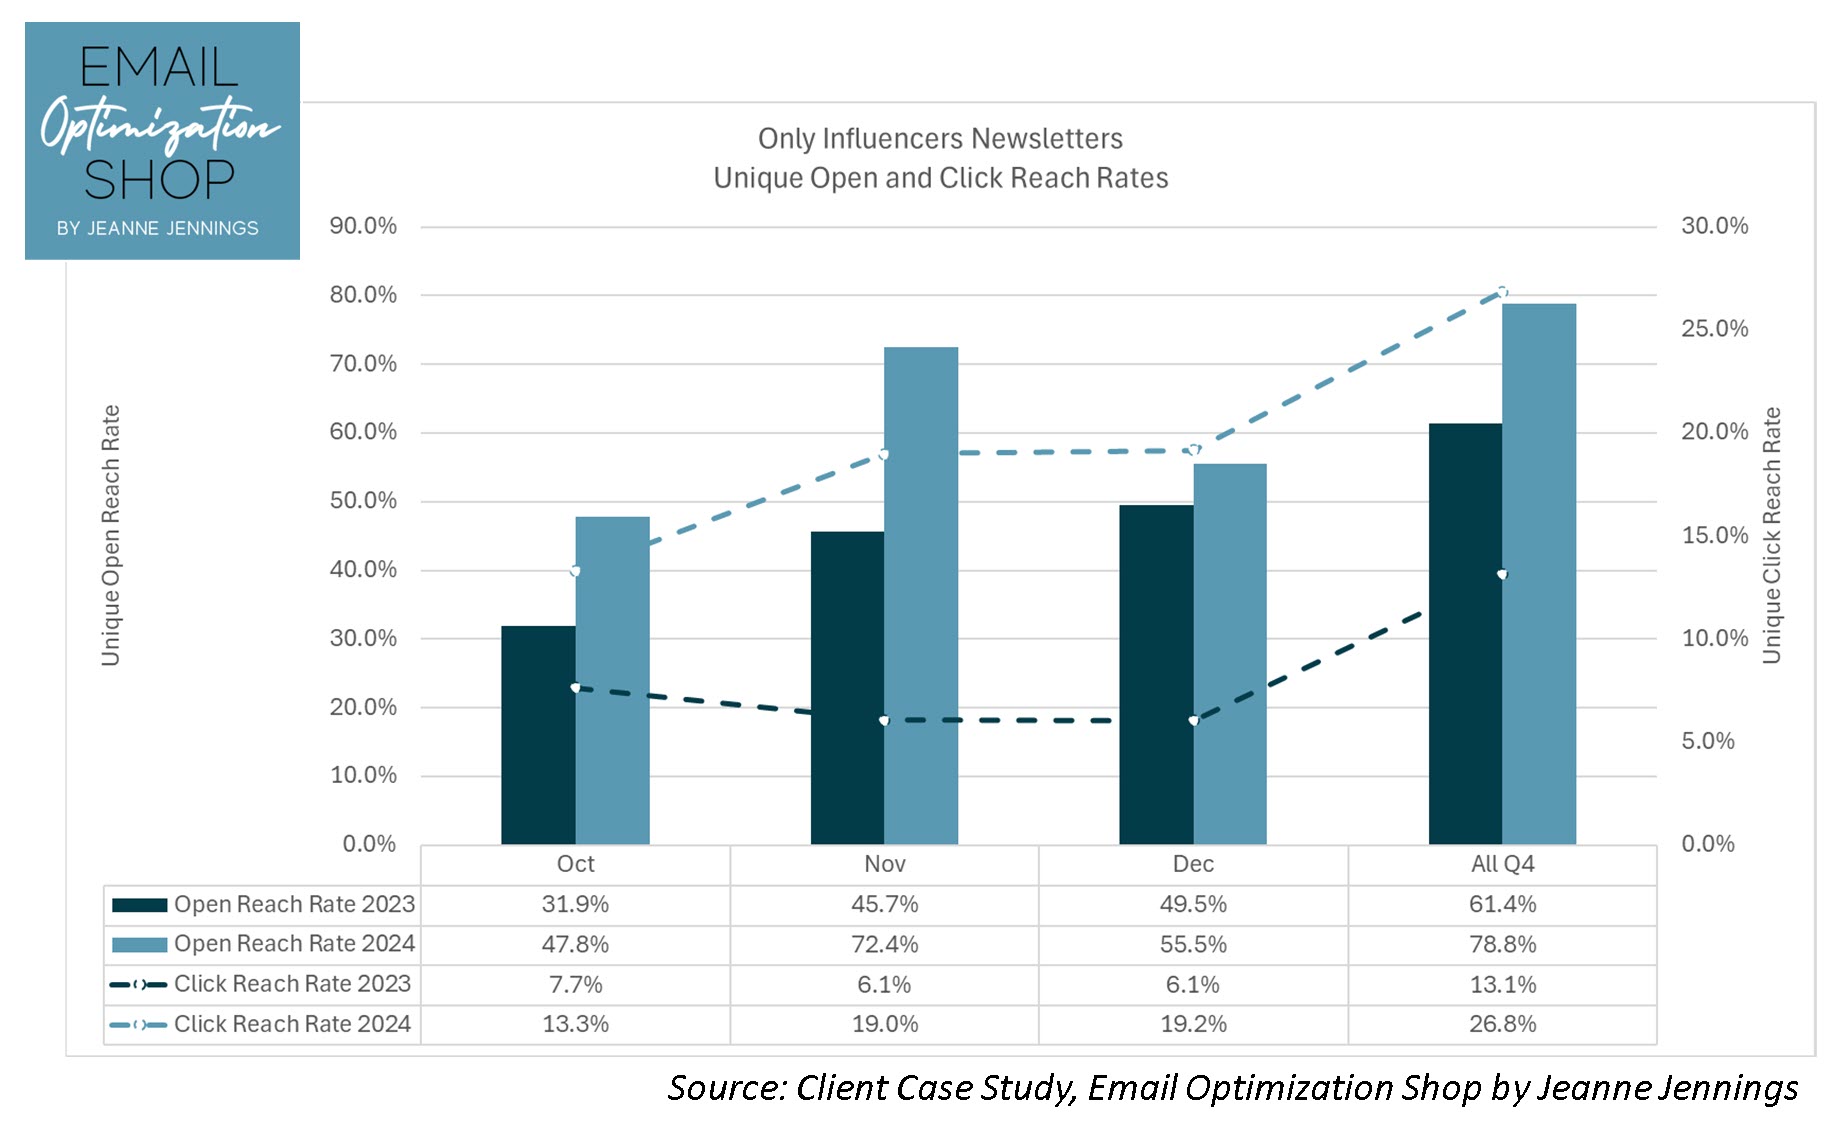
What do you see? Any surprises?
Here’s the variance report:
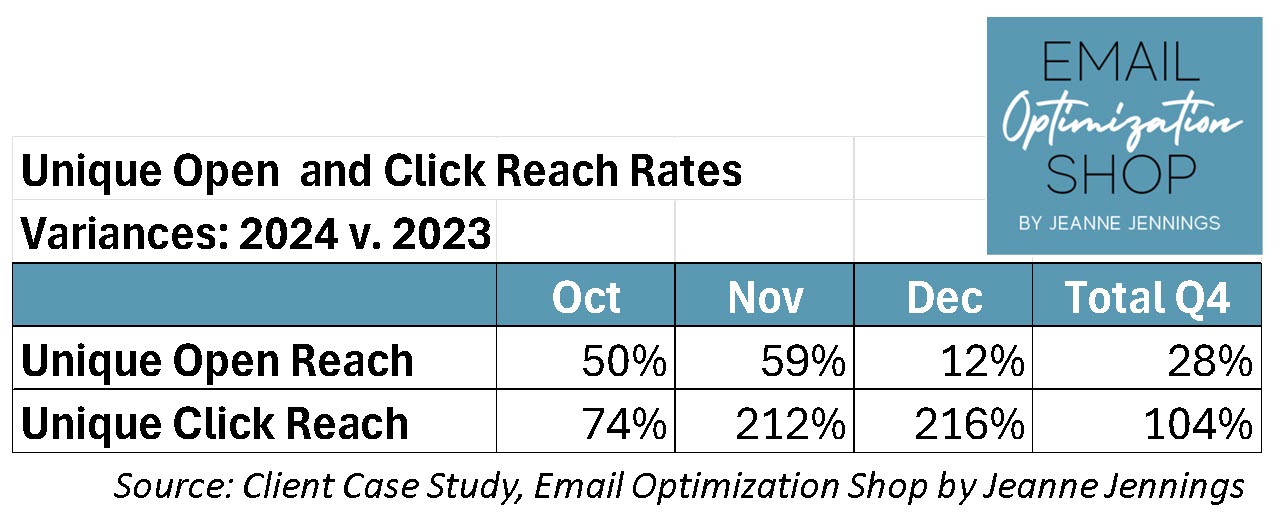
To me, the results are clear:
More frequent sends + less crowded issues = more engagement.
We didn’t just improve click-through rates. We drove significantly more total traffic and reached a broader swath of our list each month.
Worth it? Absolutely.
So if you’ve been wrestling with long newsletters — or wondering whether to bump your cadence — this might be your sign. Yes, it’s a little extra work. But if you batch smart and schedule ahead, the payoff could be well worth it.
(Is think something you should try with your newsletter? Test. Always test.)
Let me know your thoughts!
jj
 Photo by Markus Winkler on Unsplash
About the author

Jeanne Jennings is a recognized expert in the email marketing industry and a consultant who helps medium- to enterprise-sized organizations make their email marketing efforts more effective and more profitable.
She is Founder and Chief Strategist at Email Optimization Shop, a boutique consultancy focused on optimizing bottom-line email marketing performance with strategic testing.
She is also General Manager of the Only Influencers community of email marketing professionals and Chair of the annual Email Innovations Summit in Las Vegas.
Her client list includes B2B, B2C, government and non-profit clients including AARP, Capital One, Consumer Reports, Hasbro, Museum of Science: Boston, National Education Association (NEA), New York Times, UPS, US General Services Administration (GSA), and Verizon.
Jeanne is an adjunct professor at Georgetown University, teaching digital marketing to students earning their Masters in Integrated Marketing Communications from the School of Continuing Studies. She also leads industry as well as private workshops on email marketing topics.
Her book, The Email Marketing Kit: The Ultimate Email Marketer’s Bible, was published by SitePoint; she is a regular contributor to her own Email Optimization Shop blog as well as the Only Influencers blog.
Jeanne is based in Washington, DC, she earned her MBA from Georgetown University (Hoya Saxa!), and she is an avid hockey fan (Let’s Go Caps!).